CREATING MEANINGFUL MAPS WITH IGiS OVERLAY & QUERY ANALYSIS
To answer the simple geographical questions like: where is the Statue of Unity? What is the gender ratio of a particular state? How a catastrophic disaster can be predicted? In which direction the urban city is growing? All the questions are required a proper and accurate geospatial or location-based or geographic database to derive the answer. The geographic database contains the whole data of the country/state/city. To create a complete geodatabase for a particular question/problem, we need one system and that system is called GIS. It is capable of creating, manipulating, analyzing, integrating, and displaying data. GIS is used to represent Earth’s features in Digital format. The digital data of the Earth is very tedious and from that, we have to drive answers to our questions.
From this, we can easily understand GIS, and where or how it could be used in real-time applications.
A few real-time examples are an optimum or shortest path of two places using google maps, ordered food or cab details on our mobile phone like its status & locations can be easily viewed using GIS Technology. Similarly Train live status, Climate forecast details, and so on.
GIS technology connects data to a map and integrates the information to provide the best meaningful results/information.
Software for GIS is available many and it must be high user-friend way and better to have all the geospatial processes on a single platform like IGiS (Integrated GIS and Image Processing) software. The user demand is will vary based on their needs hence the assessment or identification of solutions will also vary. Therefore, the function of IGiS software is to meet user expectations on a single platform through all aspects of GIS analysis, image processing, photogrammetric image analysis, CAD, and more.
IGiS products are many and one of the IGiS Products is GIS & IP Desktop.
GIS & IP Desktop easily Creates, Views, and Analyse Your Geospatial Data.
It is an integrated GIS and Image Processing capability with advanced analysis extensions on a single platform. In addition to that, it has Efficient Image Processing Tools, Advanced Geo Processing Tools, & Integrated CAD tools.
Efficient Image Processing: IGiS has a rich array of tools and analytical models to analyze and process images. You can manage a variety of image sources like aerial, satellite, optical, microwave, LiDAR, stereo, GPR, and more. Through smart modelling techniques, IGiS efficiently visualizes, analyses, and processes image data, identify patterns, examines changes over time, and performs scientific analysis to understand spatial relationships.
Advanced Geo- Processing Tool: It is integrated GIS and Image Processing capabilities with advanced analysis extensions on a single platform. IGiS has advanced tools for GIS data conversion, analysis, and visualization. Advanced geospatial users can effectively use tools like Topology creation, Geo-processing, overlay analysis, and an attribute query builder for desired analysis and output.
The overlay analysis is a GIS process that overlays multiple datasets representing different themes/layers to analyze or identify relationships at each level. Overlay analysis represents a composite map by combining geometry with various attributes of a dataset or entity.
Basically, the Boolean methods are followed for the relational operators as per OGC standards that are used to perform different kinds of operations like union, intersection, and all. At the same time, Boolean methods are also used to test the specified topological spatial relationship between two geometric objects.
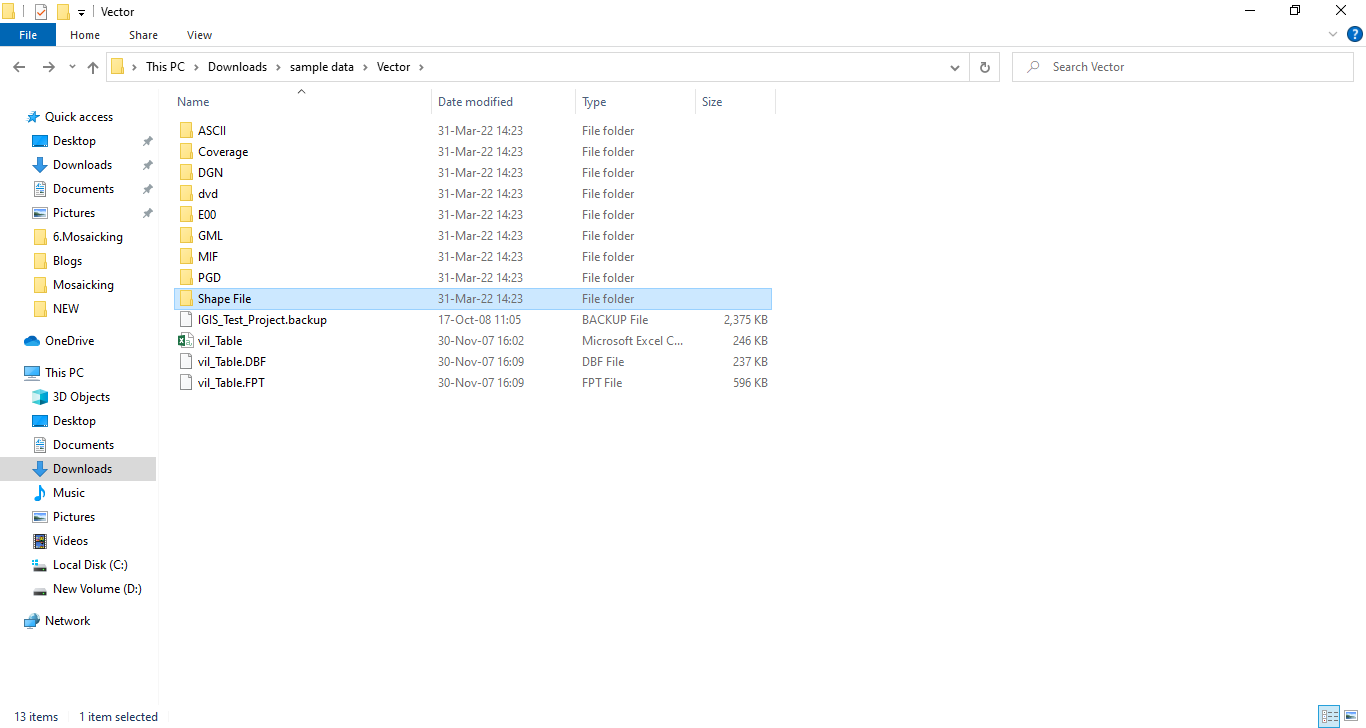
IGiS-GIS & IP 30 days Free Trial version Software is available on our website, download & install the IGiS – GIS & IP Desktop software with sample datasets.
The IGiS spatial Overlay analysis was performed by using sample data like Taluk, Road, and settlement shapefile, which are added to the software from the Sample data folder. The same projection of all the shapefile will lead to a superimposed view and users can perform the Spatial & attribute query analysis.
Here, the Overlay Analysis video is available for your reference.
» 0.00 to 0.33– Theme layers such as Taluk, settlement & road are added.
» 0.34 to 0.59 – The symbology process is done for the Taluk layer using the Legend creator option.
» 1.00 to 1.17 – Label features are added to the Taluk layer using the auto-label option.
» 1.18 to 2.24 – The symbology process for the Road & settlement layer uses the legend creator option.
» 2.25 to 3.04 – The attribute information of the Taluk, settlement & road layer is viewed.
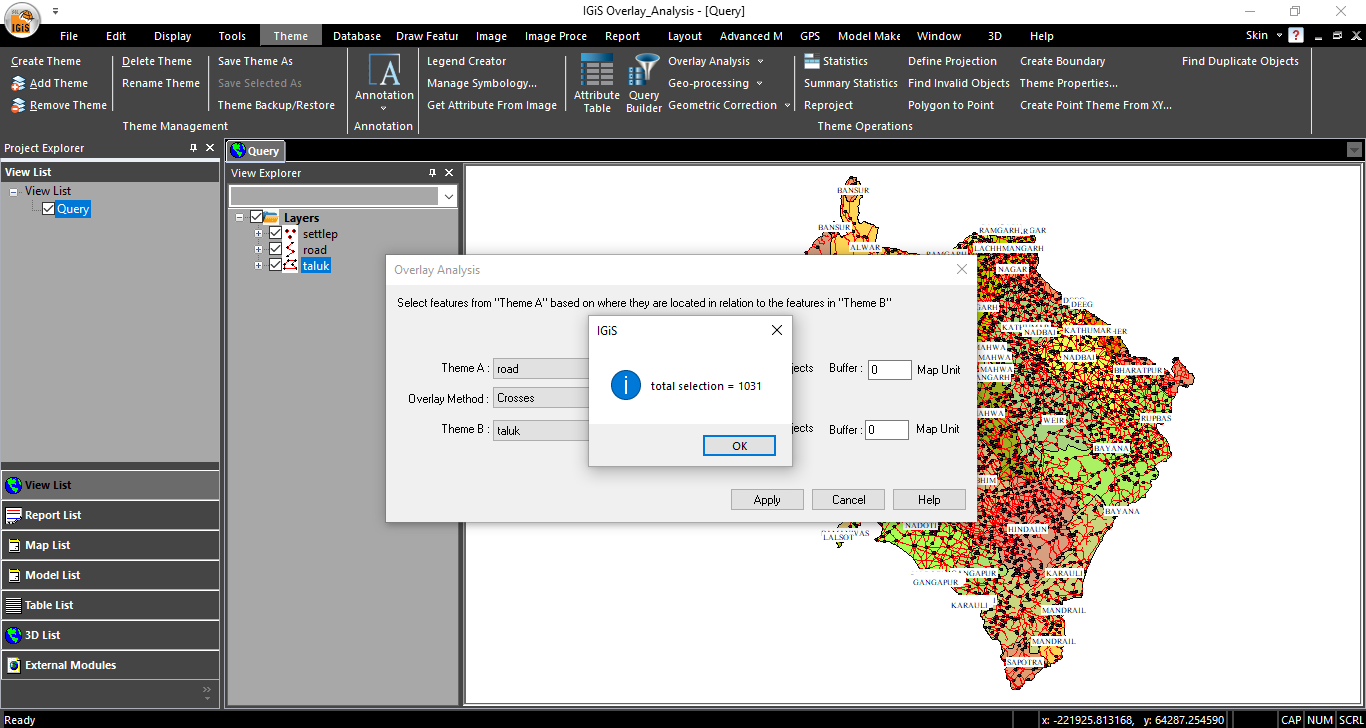
» 3.05 to 3.50 – Overlay analysis is done for how many roads are crosses the taluk boundary?
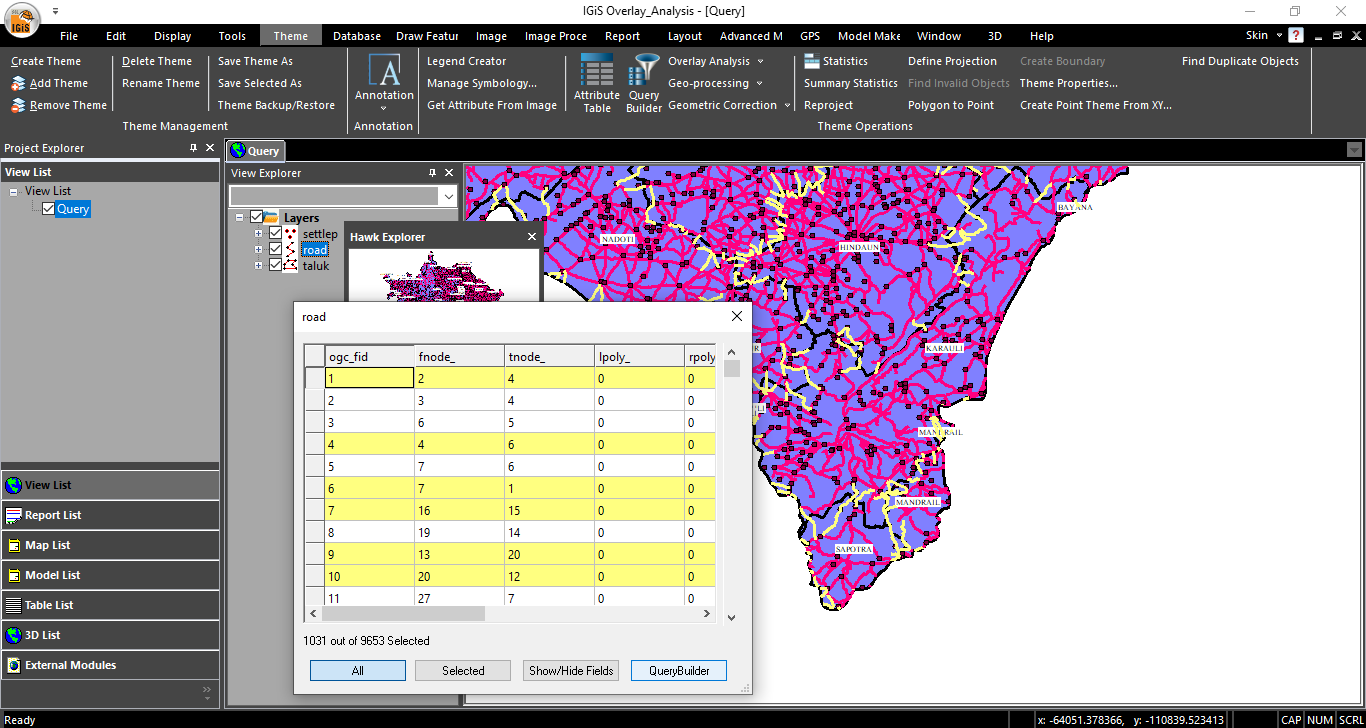
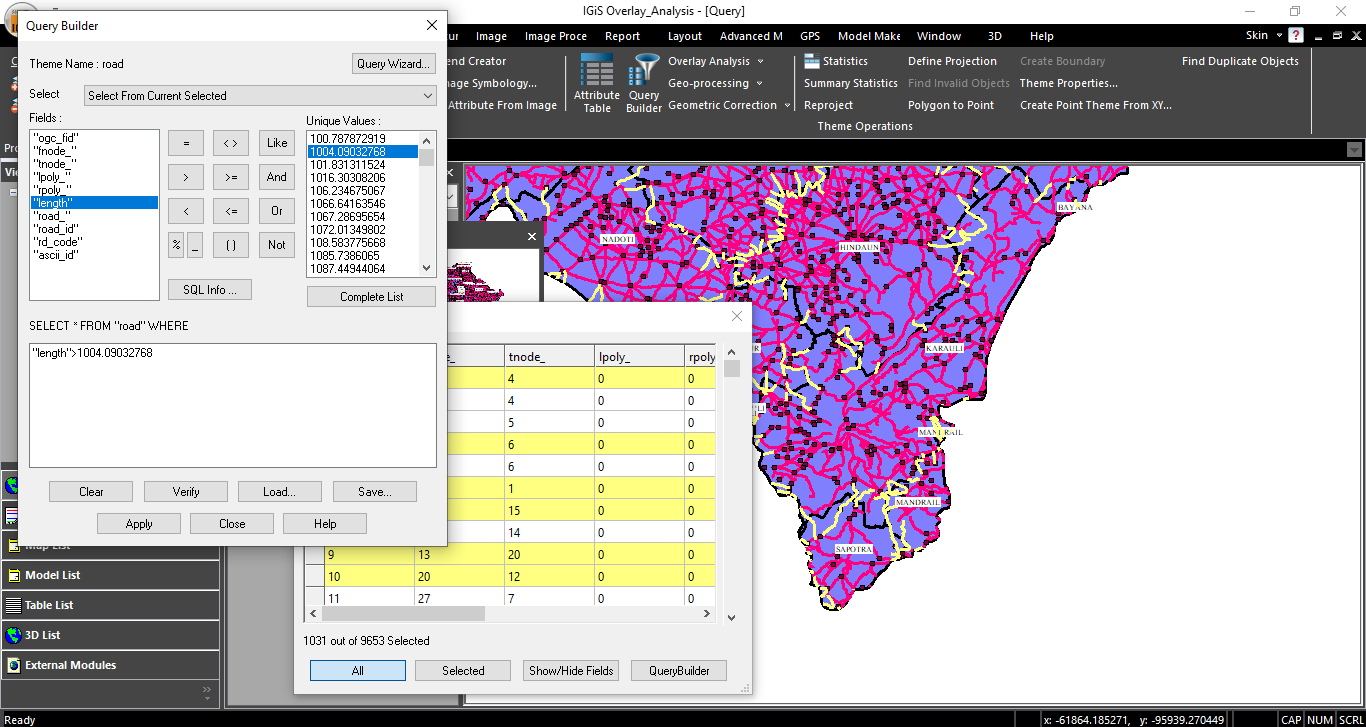
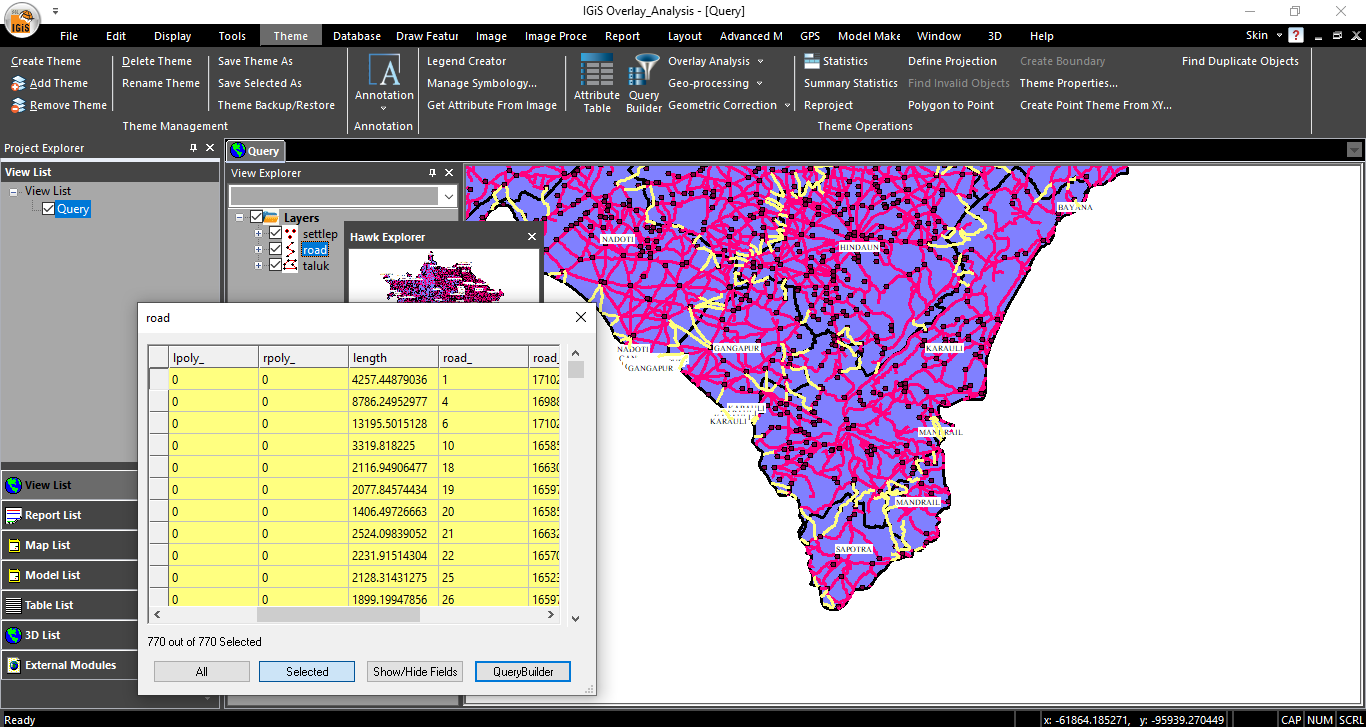
» 3.51 to 5.08 – Query performance is done for how many road lines are having more than 1000m in length in already selected 1031 road lines?
» 5.09 to 5.13 – The selection removal process is done by using the remove selection option.
» 5.14 to 5.17 – Zoom to layer process is viewed.
» 5.18 – 5.39 – Overlay analysis is done for how many settlements are within the taluk boundary?
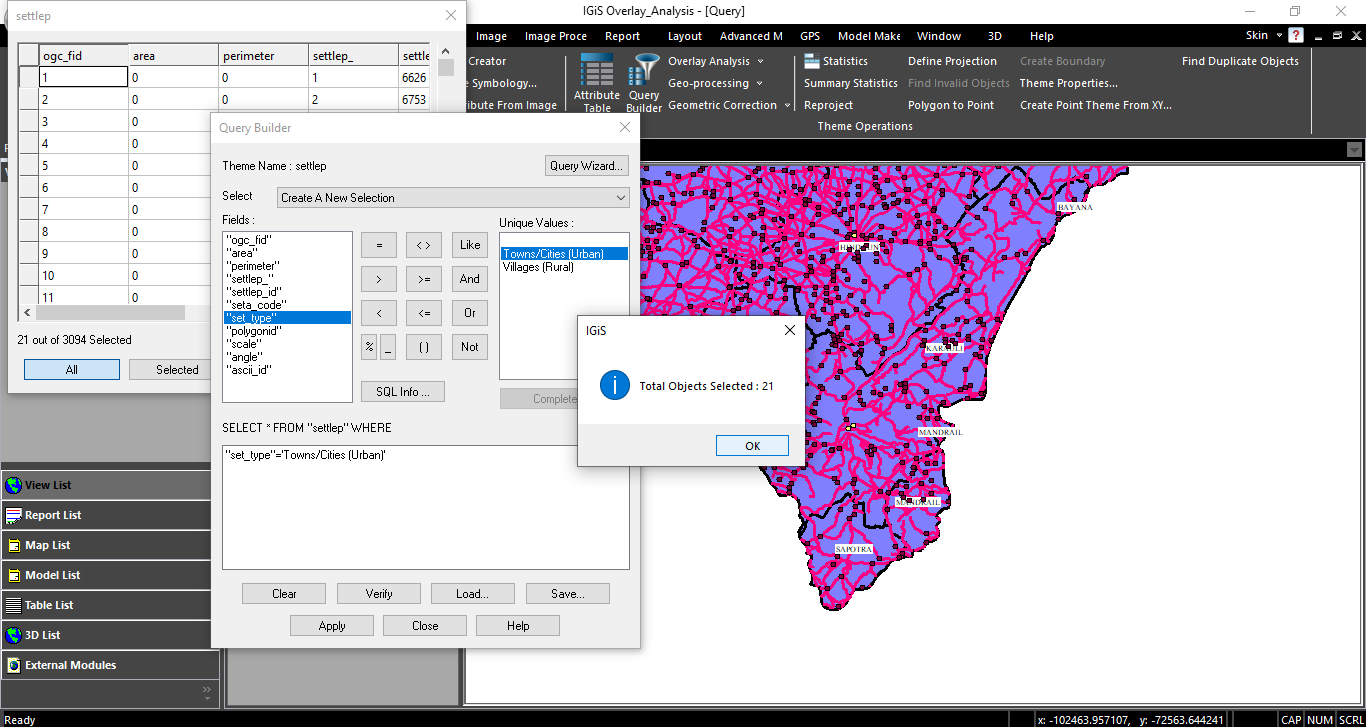
» 5.40 – 6.09 – Query performance is done for how many Towns/Cities (Urban) type settlements are available?
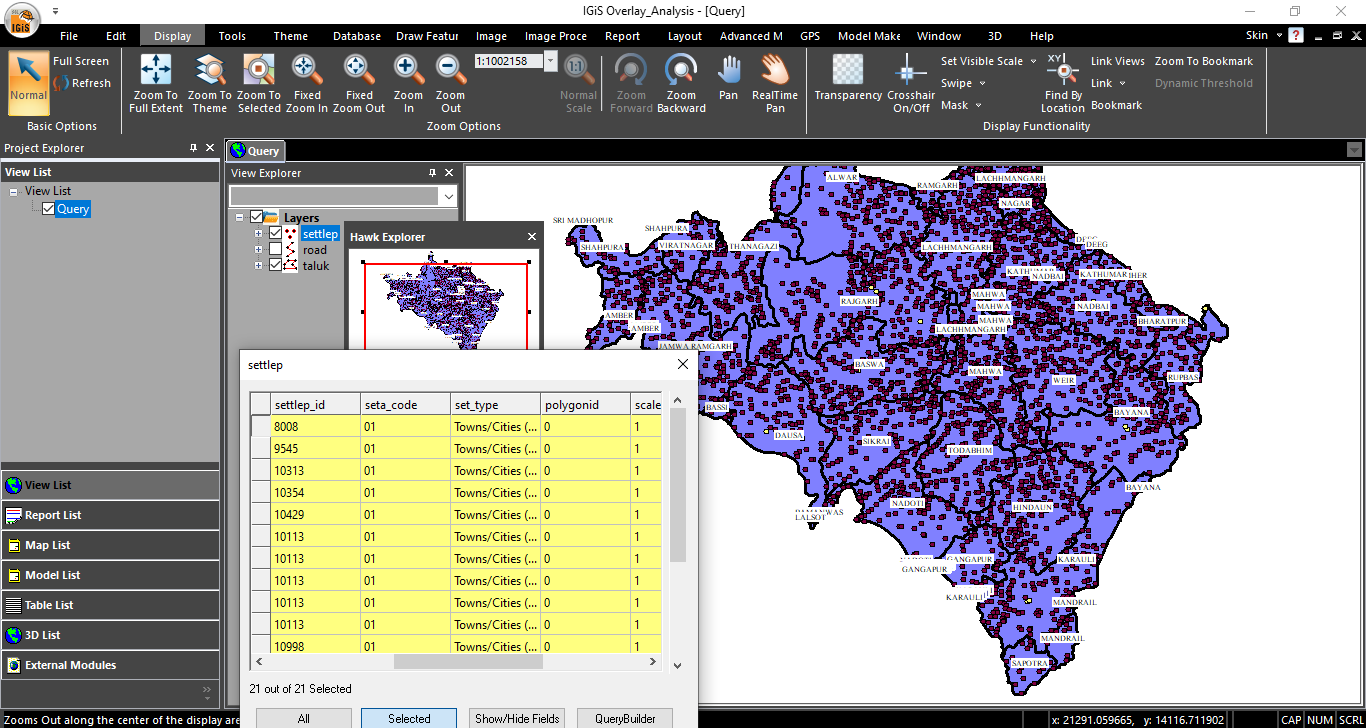
» 6.10 to 8.28 – The results of cities/towns (urban) type settlements are displayed using the blink options.
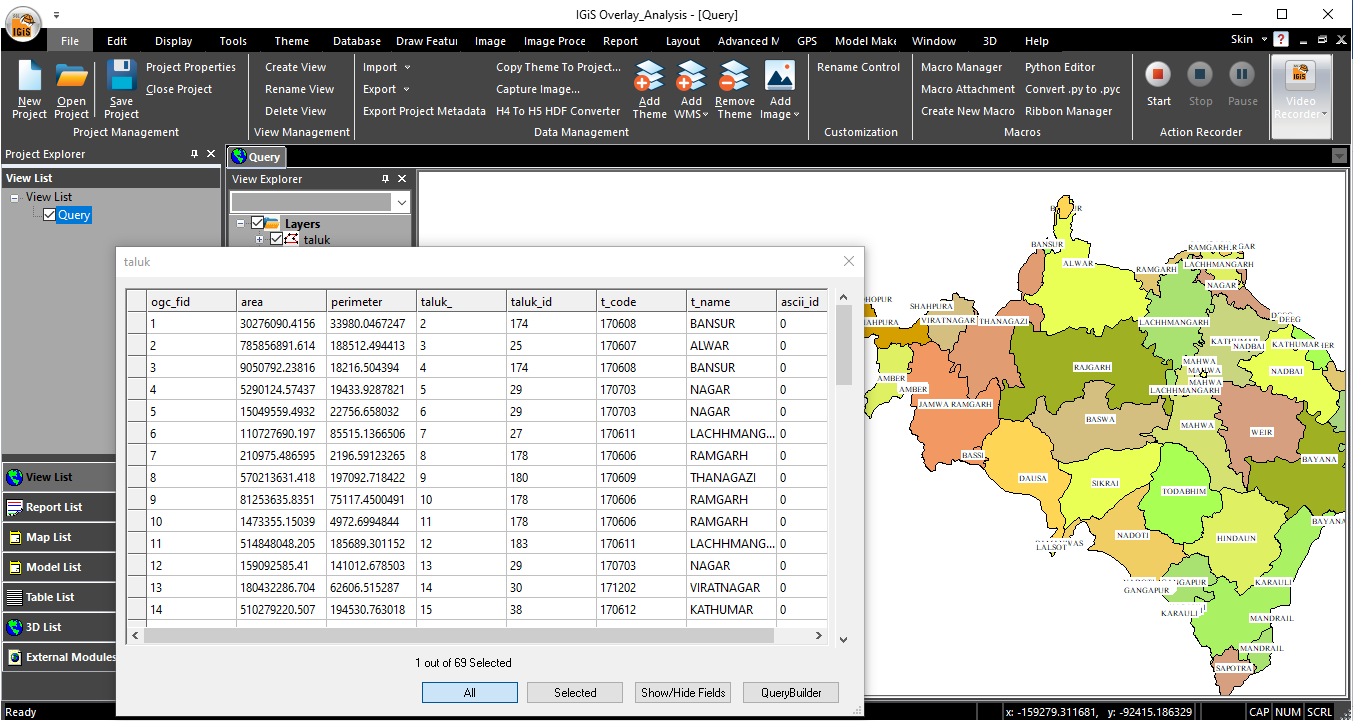
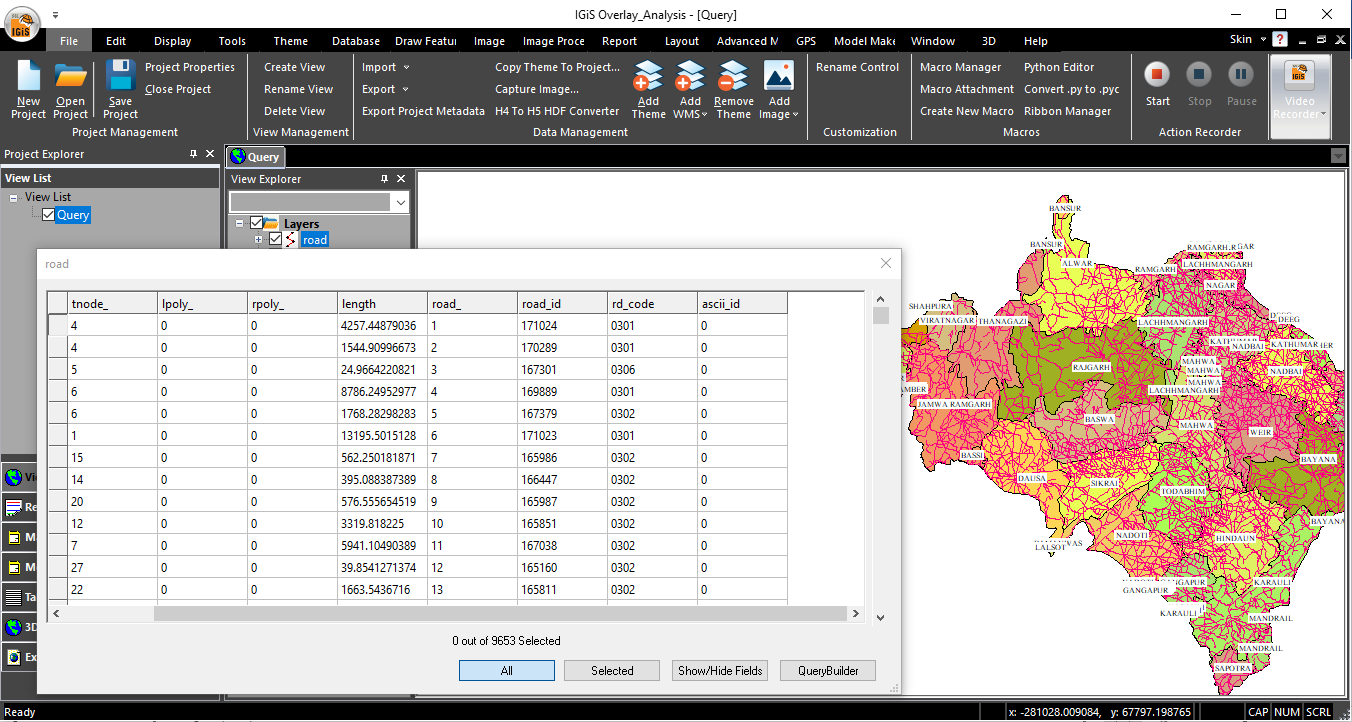
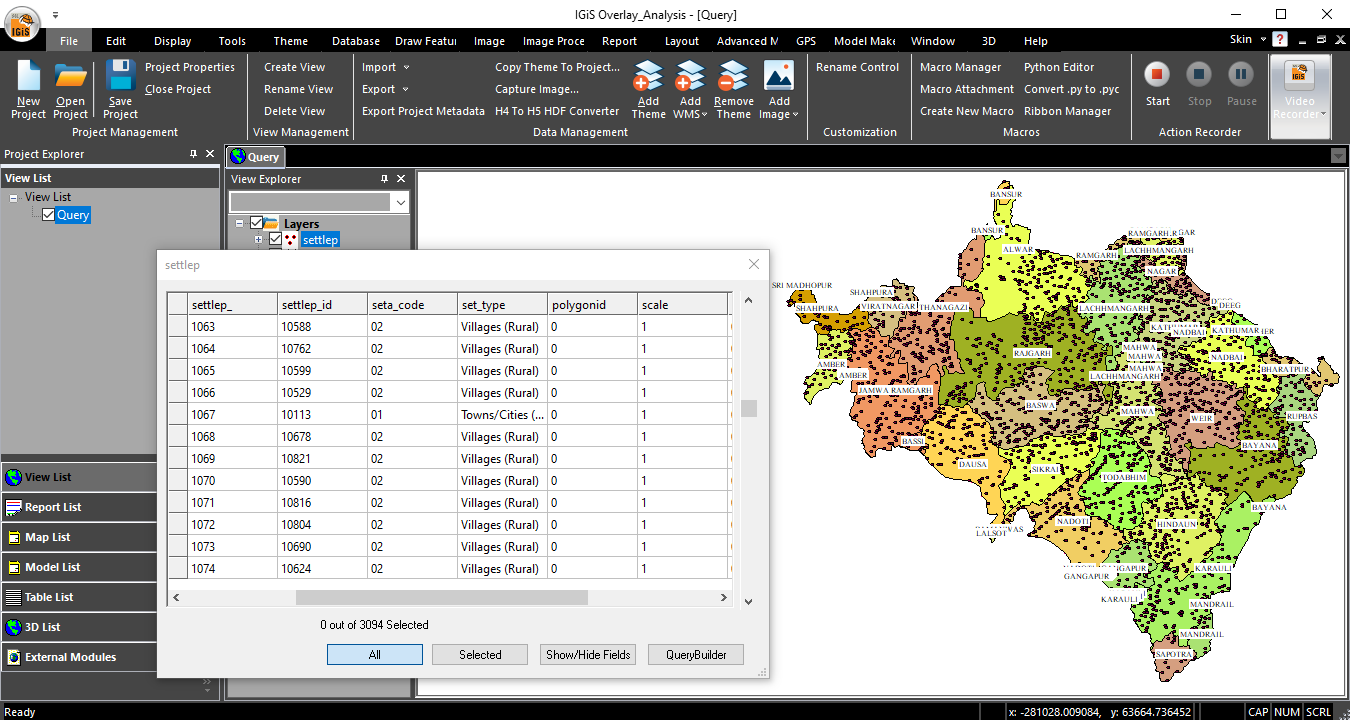
In this blog, a few overlay analyses in GIS like spatial and non-spatial queries were carried out to understand the significance of the overlay operation. As per the query, the matching objects are highlighted on the view as well as on the Attribute table. The theme layers are having n number of information and from that as per the user’s need, we have to filter the data using spatial overlay analysis. The Taluk shapefile or theme layer contains 69 taluk information like taluk Id, taluk Name, taluk Code, area, perimeter, and so on. Similarly, the road theme layer contains 9653 road line information like Road Id, Road code, Road length, and so on & the settlement theme layer has 3094 information such as settlement Id, settlement code, settlement type, and so on.
See in this bulk data nearly 10000 data, we have to take the results selectively as per our/user’s needs.
To perform the map overlay analysis we have many options such as “Contain”, “Crosses”, “Disjoint”, “Equals”, “Intersection”, “Overlap”, “Touches”, and “Within” to get the results in a very selective or precise manner. The options are derived mathematically using different operators. Each operator is unique and used to generate different types of meaningful information from the available bulk/whole data.
The following question can be answered using the Overlay Analysis in GIS.
-
1. How many roads are crosses the taluk boundary?
Generally, the “Crosses” operator determines whether the intersection results in a geometry whose dimension is less than the maximum dimension of the source geometries and the intersection set is interior to both source geometries.
Among 9653 road lines, only 1031 road lines are crossing the boundary.
-
2. In selected 1031 road lines, how many road lines are more than 1000m in length?
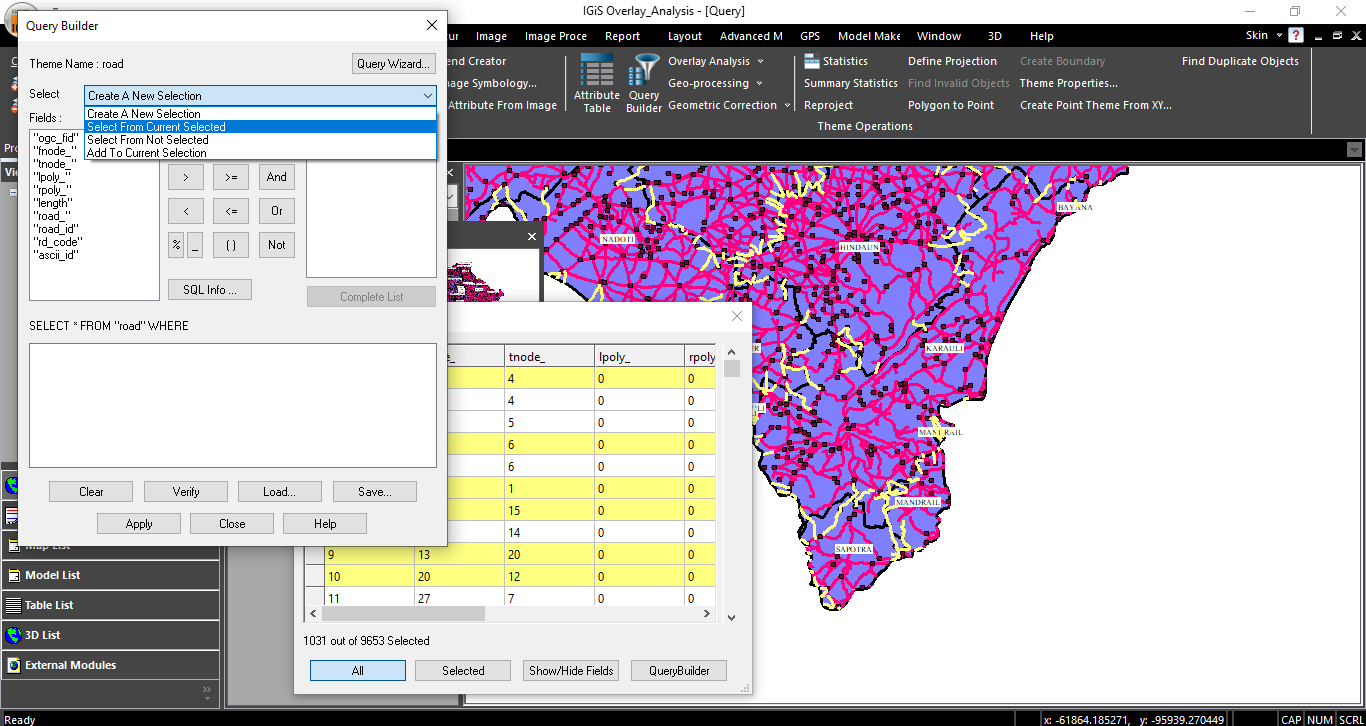
Using a non-spatial or attribute query, we have the option to perform the query analysis by mathematical symbols. In query builder, we have four options to select the objects “Create A new Selection”, “Select from Current Selection”, “Select from Not Select”, and “Add to current selection”. These are the selection options used to do further analysis. We have to enter our query and run the function result will be Displayed.
Among 1031 road lines, only 770 road lines are having more than 1000m in length.
-
3. How many Towns/Cities (Urban) type settlements are available?
Using a non-spatial or attribute query, we have the option to perform the query analysis by mathematical symbols. We have to enter our query & additionally choose the selection option. Then run the function result will be Displayed.
Among 3094 settlements, only 21 settlements come under the Towns/Cities (Urban) type.
From this, the significance of Overlay analysis in GIS can be understood clearly. Similarly, we can perform n number of overlay query analyses based on the availability of the theme layers with their information. The IGiS Overlay analysis is not limited to this, additionally, buffering options are also available to enhance the solution in an extended way.
Last but not least, spatial overlay analysis in GIS helps to find the optimum solution to critical problems. The identification of suitable sites for the waste dumping yard and sites for new construction of public-oriented service centers like railway stations, bus stands, hospitals, dams, and so on can be done through overlay analysis. Finally, the geospatial solutions are we can get from single click solution using the IGiS Software.
Latest Blog
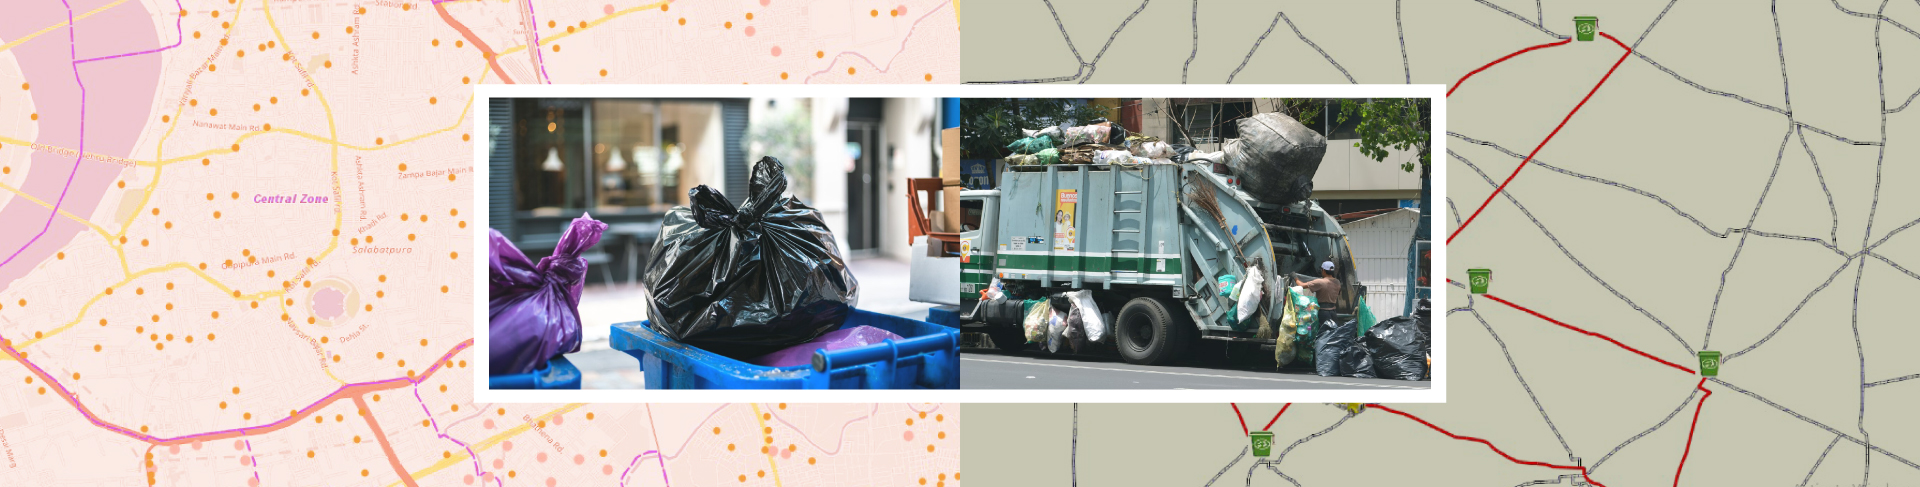
Smart Waste Management with GIS
1. Introduction: Waste management entails the responsible collection, processing, and disposal of waste materials with a focus on environmental preservation. Its core objectives include waste reduction, resource recovery, and the....
Read More